

From UA to GA4: Embracing the New Data Landscape
For marketers, tracking campaign performance and analyzing data is like breathing – essential for daily success. So, when Google announced GA4 (its new analytics platform) and the eventual sunsetting of UA, the digital marketing world took a deep breath of both excitement and caution.
Welcome to GA4, But Where Are My Reports?
GA4 boasts exciting new features, but the reporting dashboard has undergone a significant shift. Unlike UA’s predefined reports, GA4 offers fewer ready-made reports. The good news? You can now create custom reports tailored to your specific needs. However, with a completely revamped navigation system, many users struggle to find familiar reports in GA4.
Navigating the New Landscape
Unlike UA, google analytics categorizes reports into two main sections: Lifecycle and User reports. Finding the equivalent reports you used in UA might not be immediately obvious.
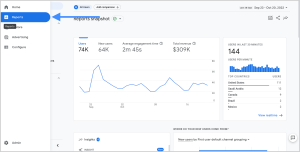
Finding Your Way Around GA4 Reports
While navigating reports in Universal Analytics involved a familiar left-hand menu, GA4 takes a different approach. Here, you’ll access reports through the “Overview” section and then drill down by clicking on specific report widgets. Once you get used to this new way of navigating, using GA4 will become second nature.
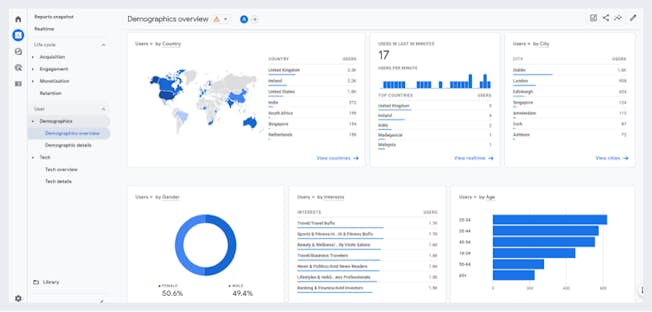
Unveiling User Data in GA4
Universal Analytics offered user reports detailing your website visitors’ demographics, location, and device usage. In google analytics, this valuable information can be found in two key areas:
- Lifecycle Reports: These reports provide insights into user acquisition, engagement, monetization, and retention. Within these reports, you can find data on demographics, location, and device usage.
- User Exploration: This section allows you to create custom reports focusing on user characteristics and behavior. Here, you can explore user demographics, location, device usage, and other relevant data points.
Unveiling User Acquisition in GA4
As digital marketers, dissecting traffic sources (channels and campaigns) is crucial for performance reporting. google analytics introduces exciting new reports to address this need: User Acquisition and User Acquisition: First User Medium.
First User Medium: This report focuses on campaign traffic, revealing how users initially found your site (e.g., email, paid search, organic search). It helps you understand the initial touchpoints that bring visitors in.
User Acquisition: Similar to First User Medium, this report offers a broader view. It showcases all default channels, not just campaign traffic, revealing how users came across your website for the first time.
These reports are a game-changer, particularly for understanding top-of-funnel activities. Unlike UA, which strictly measured site traffic and sessions, GA4 unveils how users first interact with your website. While UA offered some first-touch data in multi-channel funnels, GA4’s first-user acquisition reports are significantly more robust. By understanding these initial interactions, you can develop more effective strategies for attracting new customers.
Tracking Conversions in GA4: Unlocking Valuable Insights
Universal Analytics relied on “Goals” to track valuable user actions like purchases or form submissions. GA4 evolves this concept with “Conversions,” offering deeper insights.
While UA offered goal data by channel, device, location, etc., google analytics provides both an overview and detailed breakdowns. This allows you to spot trends and identify conversion drivers with greater clarity.
Beyond Defaults: Custom Conversions for Your Business
Similar to setting up goals in UA, GA4 utilizes events to track conversions. However, GA4 goes a step further:
Automatic Events: google analytics captures many common actions automatically (e.g., page views, purchases).
Custom Events: You can create custom events specific to your website and business needs (e.g., reaching a specific page, user interaction with a unique element). This can be achieved through tools like Google Tag Manager for non-standard interactions.
By designating these events as conversions, you gain valuable insights:
Conversion Drivers: See which channels, campaigns, locations, and devices are leading to the most conversions.
Data-Driven Decisions: Optimize your marketing efforts by focusing on campaigns and keywords that drive the most conversions. Conversely, de-prioritize less effective campaigns, saving time and resources.
Ecommerce Tracking in GA4: Unlocking Revenue Insights
For e-commerce websites, Universal Analytics offered valuable e-commerce data within Goal reports. This revealed which campaigns, channels, keywords, email marketing efforts, devices, and locations generated the most revenue.
Fortunately, google analytics seamlessly carries over this functionality. You can access this data in the Monetization > Ecommerce Purchases reports. This allows you to continue tracking your revenue drivers and optimize your marketing strategies for maximum impact.
In this article, we discussed the function and importance of SEO in the digital world. If you are interested, you can learn more about digital marketing and Google advertising by viewing other articles on the Kayoads website.
Website desgin
Using our website design and development service with KayoAds

Android & IOS
Broaden your business horizons with top-notch mobile app development services

SEO Tools
At Kayoads, we specialize in delivering top-notch SEO optimize services